
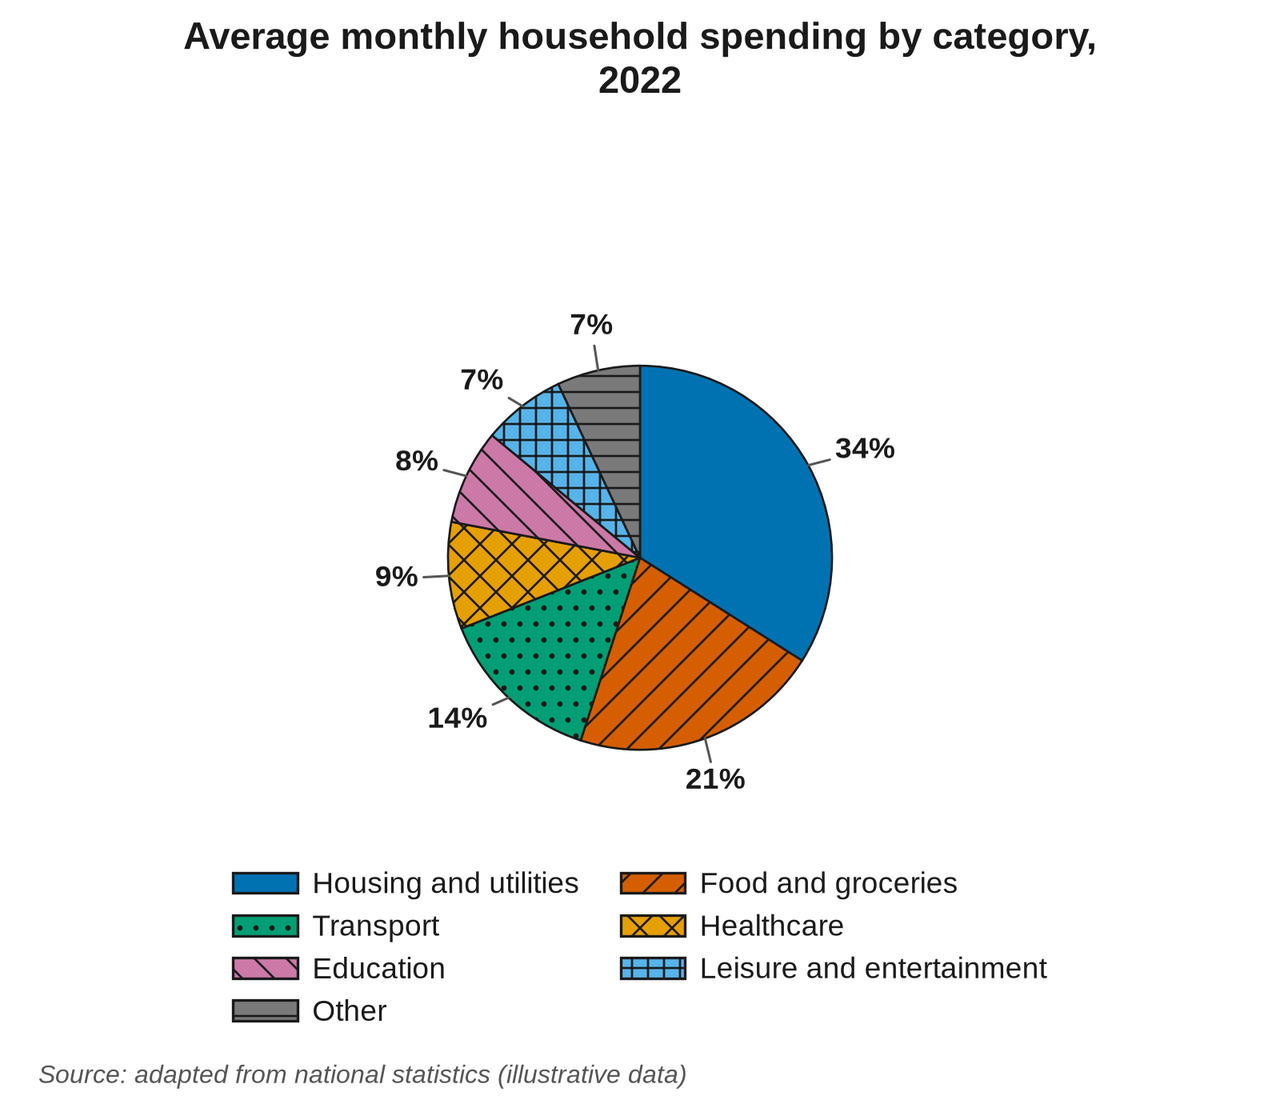
The pie chart shows how average monthly household spending was divided among seven categories in a mid-sized country in 2022. Overall, housing and utilities accounted for the largest proportion by a considerable margin, while spending on essentials such as food and transport made up a large part of the remainder.
Housing and utilities was the largest single category at 34 per cent, some 13 percentage points higher than food and groceries at 21 per cent. Food and groceries came second, followed by transport at 14 per cent. Together, these three categories account for 69 per cent of total spending.
Healthcare and education each took a smaller share, at 9 and 8 per cent respectively, and together they account for 17 per cent of spending, slightly more than transport alone. Leisure and entertainment and the miscellaneous other category were the smallest, each at 7 per cent.
Taken as a whole, housing, food, transport and healthcare make up 78 per cent of spending, a considerably larger share than the remaining categories combined, which total just 22 per cent.